Designing a reliable hydraulic system in China requires more than selecting a powerful pump. Engineers must match pressure, flow, temperature, operating cycles, and installation conditions. The real question is: what are key factors in hydraulic system design? A practical answer begins with the machine’s actual workload. A construction excavator needs shock resistance and precise motion control. A factory press needs stable pressure and repeatable force. These demands shape every component, from the reservoir and valves to the hoses and filtration system.
Experience shows that small details often decide long-term performance. A correctly sized return filter can protect sensitive valves from contamination. A cooler may prevent oil temperatures from rising during continuous operation. Clear hose routing can reduce vibration, abrasion, and maintenance time. Engineers should also consider noise, energy efficiency, safety protection, spare parts, and local service support. Professional suppliers normally verify calculations through simulations, prototype testing, pressure checks, and documented quality inspections. Reliable manufacturers should explain material grades, test standards, warranty conditions, and delivery controls clearly.
No design is perfect. Early assumptions may be wrong. Actual dust, humidity, operator habits, or unexpected load changes can expose weaknesses after installation. That is why field feedback matters. A strong China hydraulic system design combines engineering calculations with hands-on commissioning and honest review. It should remain safe, efficient, maintainable, and adaptable throughout its service life. Performance matters. So does accountability.
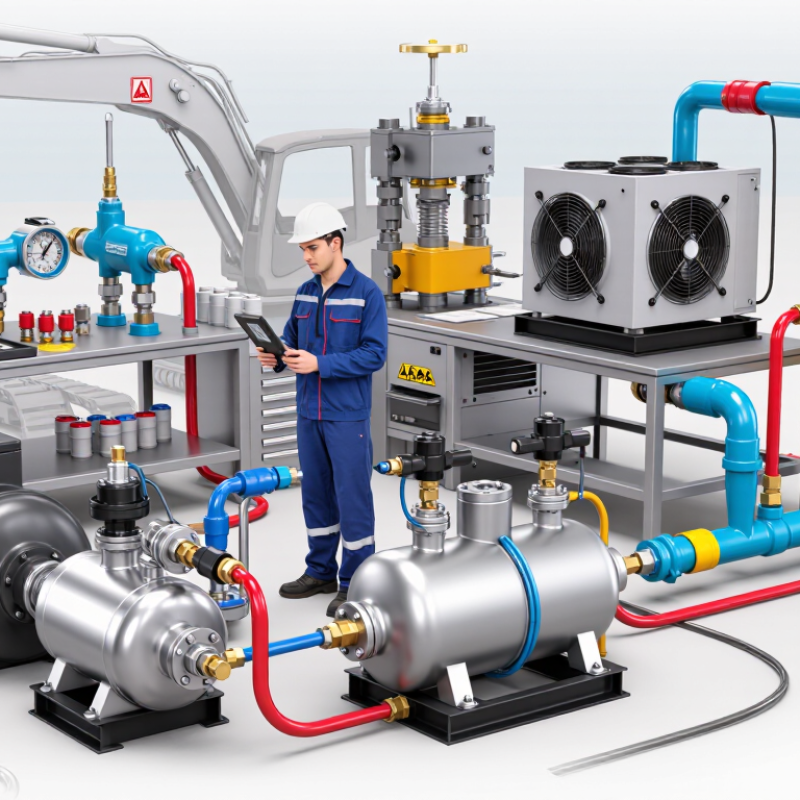
China Best Hydraulic System Design: What Are Key Factors
Define China Hydraulic Design Targets: 210–350 bar, Flow, and Duty Cycle
A reliable hydraulic design starts with clear operating targets. Set the working pressure between 210 and 350 bar, then confirm peak pressure separately. Do not treat maximum pressure as a daily setting. Flow requirements depend on actuator speed, pump displacement, and machine response. For example, a cylinder needing 60 liters per minute will behave poorly with an undersized valve. Duty cycle matters just as much. A press running eight hours daily needs different cooling and filtration than an occasional lifting unit. Small details matter.
Field checks often reveal gaps between calculations and real operation. Oil temperature can rise during repeated cycles, especially inside compact enclosures. Pressure losses across hoses and valves also reduce useful power. I would measure flow at operating temperature, not only in a workshop test. A first estimate is rarely perfect. Sometimes, the selected pump is too large, creating heat and unnecessary energy use. Relief valve settings, reservoir volume, contamination control, and emergency stopping behavior should be documented by qualified engineers.
Tips: Record pressure, flow, oil temperature, and cycle time during a full shift. Leave design margin, but avoid excessive oversizing. Review the duty cycle with operators. Their practical feedback may expose shock loads, idle periods, or frequent starts that the original specification missed. Use verified calculations and test results before final approval.
| Design Dimension | Recommended Target or Range | Engineering Basis | Key Design Considerations | Verification Method |
|---|---|---|---|---|
| Maximum Working Pressure | 210–350 bar | Defines the continuous pressure level required by the actuator and load. | Select pumps, valves, cylinders, hoses, fittings, and manifolds with a rated working pressure above the maximum system pressure. Account for pressure spikes and shock loads. | Confirm component ratings, pressure-transient calculations, and pressure-test results. |
| Relief-Valve Setting | Typically 5–10% above the maximum operating pressure, but below the lowest circuit-component rating | Provides overload protection without exceeding the allowable pressure of the weakest component. | The final setting must consider pump capability, actuator load, temperature, pressure spikes, and the manufacturer’s component limits. | Measure the setting with a calibrated pressure gauge under controlled operating conditions. |
| Design Flow Rate | Calculated from actuator speed and displacement; commonly 10–250 L/min for industrial circuits | For a hydraulic actuator, flow determines speed. For a motor, flow determines rotational speed and available torque in combination with pressure. | Allow for leakage, volumetric efficiency, simultaneous functions, and flow demand during acceleration or regeneration. | Verify actual flow at the design pressure and operating temperature using a calibrated flow meter. |
| Pump Displacement | Selected from required flow, pump speed, and volumetric efficiency | Pump flow can be estimated using: Q = Vg × n × ηv / 1,000, where Q is in L/min, Vg is displacement in cm³/rev, and n is speed in rpm. | Check minimum and maximum pump speed, case-drain flow, noise, inlet conditions, and pressure-compensator response. | Compare measured flow with calculated flow across the expected pressure and speed range. |
| Hydraulic Power | Phyd = p × Q / 600 kW | Pressure p is in bar and flow Q is in L/min. For example, 300 bar at 100 L/min equals approximately 50 kW of hydraulic power. | Size the prime mover for total hydraulic power, efficiency losses, starting conditions, and peak demand. | Compare motor input power, pump output pressure, flow, and total efficiency during testing. |
| Overall Efficiency | Approximately 80–90% for a well-designed system | Overall efficiency combines pump, motor, valve, actuator, mechanical, volumetric, and hydraulic losses. | Higher pressure, high oil temperature, leakage, throttling, and undersized lines can reduce efficiency and increase heat generation. | Calculate efficiency from electrical or mechanical input power and measured hydraulic output power. |
| Duty Cycle | Define operating percentage, such as 25%, 50%, 75%, or 100% of the machine cycle | Duty cycle determines average power, heat load, fatigue exposure, and component life. | Record pressure-flow combinations for standby, idle, working, peak-load, and unloading periods rather than using only average pressure. | Use a cycle-time study or data logger to measure pressure, flow, temperature, and operating time. |
| Continuous Operating Temperature | Approximately 30–60°C oil temperature; avoid sustained operation above the fluid and seal limits | Temperature affects viscosity, leakage, seal life, oxidation, and heat dissipation. | Size the reservoir, cooler, and airflow or water-cooling system for the calculated continuous heat load. | Measure reservoir and return-line temperature during the highest expected duty cycle. |
| Fluid Viscosity at Operating Temperature | Typically 15–46 cSt, subject to pump and valve requirements | Correct viscosity supports lubrication, volumetric efficiency, and acceptable pressure loss. | Do not select viscosity based only on ambient temperature; evaluate cold-start viscosity and hot-running viscosity. | Check the fluid data sheet and measure viscosity or temperature against the fluid specification. |
| Pressure-Line Velocity | Approximately 3–5 m/s | Moderate velocity limits pressure drop, noise, turbulence, and heat generation in pressure lines. | Use a lower velocity for long lines, sensitive proportional controls, high-viscosity fluids, or systems requiring low noise. | Calculate velocity from flow and internal pipe diameter, then verify pressure loss under operating flow. |
| Return-Line Velocity | Approximately 2–3 m/s | Return lines should limit back pressure and reduce aeration and turbulence before the reservoir. | Check back pressure at the actuator, valve, filter, cooler, and return manifold under peak return flow. | Measure return-line pressure and compare it with actuator and valve limits. |
| Suction-Line Velocity | Approximately 0.6–1.2 m/s | Low suction velocity helps prevent excessive pressure drop and cavitation at the pump inlet. | Use short, large-diameter suction lines with minimal restrictions; avoid sharp bends and undersized strainers. | Check inlet pressure, vacuum level, oil temperature, and pump noise during cold and hot operation. |
| Filtration Level | Commonly 10–25 μm nominal for return filtration; finer pressure filtration may be required for sensitive valves | Clean fluid reduces abrasive wear, sticking, leakage, and premature failure. | Filter selection must match component cleanliness requirements, flow, pressure, bypass setting, and dirt-holding capacity. | Monitor filter differential pressure and perform periodic fluid cleanliness testing to ISO 4406. |
| Fluid Cleanliness | Often ISO 4406 code 18/16/13 or cleaner, depending on component sensitivity | Cleanliness requirements are determined by the most contamination-sensitive component in the circuit. | Proportional and servo valves generally require cleaner fluid than basic directional valves and cylinders. | Take representative oil samples and analyze particle-count results using ISO 4406 reporting. |
| Reservoir Capacity | Commonly 2–3 times the pump flow per minute for conventional systems | Provides residence time for deaeration, cooling, contamination settling, and volume compensation. | Final sizing depends on duty cycle, cooling method, installation space, cylinder volume changes, and fluid expansion. | Confirm minimum fluid level, maximum fluid level, residence time, and thermal performance during full-cycle testing. |
| Pressure Drop Allowance | Keep line and component losses as low as practical; allocate pressure-loss budgets by circuit section | Pressure loss reduces actuator force, wastes energy, and generates heat. | Evaluate hoses, pipes, fittings, valves, filters, coolers, and quick couplings at maximum flow—not only nominal flow. | Measure pressure before and after major components at minimum, nominal, and peak flow. |
| Safety and Compliance Basis | Design, installation, and risk assessment aligned with applicable hydraulic-system safety requirements | Hydraulic systems at 210–350 bar can store significant energy and may cause injection, crushing, or unexpected-motion hazards. | Include guarding, hose restraint, lockout procedures, pressure relief, controlled descent, emergency stop logic, and maintenance access. | Complete documented risk assessment, pressure testing, functional testing, and inspection before commissioning. |
| Design Note: The values shown are practical preliminary design targets for industrial hydraulic systems. Final values must be validated against the selected component ratings, hydraulic fluid specification, machine risk assessment, applicable standards, environmental conditions, and measured duty-cycle data. | ||||
Hydraulic units can waste substantial electricity through throttling, leakage, friction, and motor losses. A pressure gauge is not enough. Record motor power, pressure, flow, oil temperature, and cycle time during production.
It adjusts pump displacement according to actuator demand. During standby, the pump can reduce flow and unnecessary pressure losses. This lowers heat generation and may reduce cooling requirements.
Compare electrical input with hydraulic output. Hydraulic power equals pressure multiplied by flow. For example, 10 kilowatts entering and 7 kilowatts delivered creates about 3 kilowatts of heat.
Excessive heat may indicate valve throttling, internal leakage, friction, or motor inefficiency. It can require a larger cooler and more fan power. Oil life may also become shorter. Heat is a useful warning.
Laboratory efficiency rarely matches field performance. Dirty filters, aging seals, and incorrect standby pressure can reduce output quietly. Test different loads, cycle times, and temperatures. The original model may be too optimistic.
Verify pressure, movement, stored energy, and unexpected starting conditions. Check every hose, actuator, valve, and connection against the highest working pressure. Relief devices should protect the circuit. Guards should block moving parts and escaping oil.
Increase pressure gradually and inspect joints for leaks, vibration, and abnormal heat. Check whether cylinders hold their loads after the pump stops. Test emergency controls carefully. A small leak can become a serious maintenance issue.
Confirm hose routing, bend radius, abrasion protection, pressure rating, and identification. Use clean oil and suitable filtration. Record test results, component ratings, inspection dates, and maintenance access. Replacement parts deserve the same scrutiny.
Designing a reliable hydraulic system in China begins with clearly defining operating targets, including a working pressure of approximately 210–350 bar, required flow rate, response speed, and duty cycle. The selection of pumps, valves, actuators, and auxiliary components should match these conditions, while maintaining an expected volumetric efficiency of around 80–90%. Careful sizing helps reduce pressure losses, improve machine performance, and extend component service life.
Understanding what are key factors in hydraulic system design also requires strict fluid cleanliness management. Maintaining oil quality at ISO 4406 level 18/16/13 or better can reduce wear and minimize unexpected failures. Energy efficiency should be improved through load-sensing control, appropriate standby pressure, and heat balance analysis to prevent excessive temperature rise. Finally, the complete system must be tested for safe operation, durability, emergency performance, and maintenance accessibility in accordance with ISO 4413 and GB/T 3766 requirements.

 Aksurion Hydraulic