Hydraulic systems power excavators, presses, injection machines, and aircraft equipment. Yet installed power rarely equals useful output. The question is practical: what affects the performance of hydraulic systems? Pressure losses, contaminated fluid, leakage, poor sizing, heat, and unstable control settings all matter. A pump may deliver the correct flow at the test bench, then perform poorly beside a hot steel frame.
Industry data shows why efficiency deserves closer attention. The U.S. Department of Energy identifies throttling, leakage, and excessive pressure as common sources of hydraulic energy waste in industrial systems. NFPA’s Fluid Power Shipment Statistics also tracks the continuing scale of the fluid power industry, where reliability and energy management remain commercial priorities. These reports do not provide one universal efficiency number. That limitation matters. Actual results depend on duty cycle, oil viscosity, maintenance quality, and machine age.
ISO 4413:2010 provides essential principles for hydraulic fluid power systems, including safe design, component selection, and risk reduction. However, compliance alone cannot correct an undersized return line or a clogged filter. Technicians often find the evidence at the machine: a pump casing running unusually warm, a relief valve hissing during idle periods, or oil darkened by repeated overheating. Better performance begins with measurement, not assumptions. Record pressure, flow, temperature, cycle time, and leakage under real operating conditions. Then compare those readings with manufacturer specifications and maintenance records. Some improvement plans fail because they chase peak pressure instead of useful work. That mistake is easy to repeat.
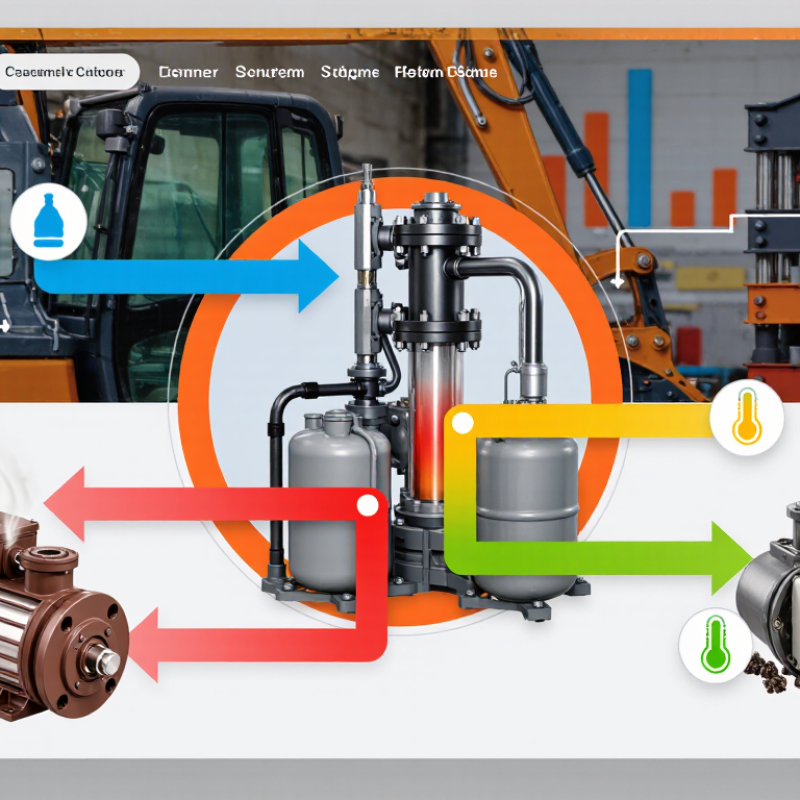
An 80–90% overall efficiency target is practical for many hydraulic systems. It includes the motor, pump, valves, actuators, and transmission lines. The U.S. Department of Energy reports that pumping systems can achieve 20–50% energy savings through better design, control, and maintenance. Oversized pumps often create avoidable losses. A pressure gauge may show 210 bar, while the actuator needs only 160 bar. That difference becomes heat.
Measure before changing components. Record input electrical power, hydraulic pressure, flow rate, oil temperature, and useful actuator output. A simple power balance can expose leakage, throttling, and mechanical friction. The International Energy Agency estimates electric motor-driven systems consumed about 46% of global electricity in 2011. Hydraulic equipment is only one part of that total, but motor losses still deserve attention. Check filters, hose restrictions, relief-valve activity, and standby pressure during a normal production cycle. Small details matter.
The 80–90% target is not sacred. Some intermittent systems may justify lower efficiency because duty cycles are short. A calculated 87% can still hide unstable pressure or overheated oil. That is a warning. Use measurements from several operating shifts, not one convenient test. Recheck performance after repairs, because efficiency can decline quietly through contamination, seal wear, or incorrect settings.
Sources: U.S. Department of Energy, Improving Pumping System Performance: A Sourcebook for Industry; International Energy Agency, Energy-Efficiency Policy Opportunities for Electric Motor-Driven Systems.
How to Improve Hydraulic System Performance
Hydraulic performance often declines before pressure or flow readings look abnormal. Fluid contamination is a common hidden cause. A practical target is ISO 4406 cleanliness code 17/15/12 or better. This code measures particles at three size ranges. Lower numbers indicate cleaner fluid.
In field maintenance, sampling technique matters as much as filtration. Take samples from a turbulent, representative point, not from the reservoir surface. Use clean containers and record operating conditions. A sample collected after shutdown may show misleading results. Test new oil before adding it. Fresh fluid is not always clean enough for a sensitive system.
Control contamination at every entry point. Seal filler openings during service, and inspect damaged rod seals after dusty operation. Use suitable breathers and maintain filter indicators. Replace elements according to condition, not habit alone. Fine filtration can remove harmful particles, but it cannot correct water ingress or poor handling. A short cleanliness log helps reveal recurring problems. Record the ISO code, sampling location, filter condition, and recent repairs.
A clean report is not proof of a clean machine. Sampling errors happen. Targets also need review when valves, pumps, or servo components change. If results remain above 17/15/12, investigate the source before increasing filter frequency. Excessive restriction can reduce flow and create another failure. Better control comes from measured evidence, consistent procedures, and honest review of what the data does not show.
Particle counts are shown per millilitre of hydraulic fluid. The target condition, ISO 4406 code 17/15/12 or better, corresponds to fewer than 1,300 particles ≥4 μm, fewer than 320 particles ≥6 μm, and fewer than 40 particles ≥14 μm per millilitre. Lower particle counts indicate cleaner fluid and reduced wear risk.
How to Improve Hydraulic System Performance
Keeping pressure loss below 10% begins with measured operating data, not guesswork. Record pressure at the pump outlet and actuator inlet during peak demand. The difference reveals real circuit loss. The U.S. Department of Energy’s Pumping System Assessment Tool identifies friction, throttling, and oversized equipment as common efficiency penalties. In hydraulic circuits, unnecessary pressure creates heat. A 10 bar drop across a valve can quietly raise cooling demand.
Match pump flow to actual actuator requirements. Excess flow often returns through relief valves, wasting power as heat. Use a calibrated flow meter and check pressure under working load. The National Fluid Power Association’s efficiency guidance emphasizes reducing throttling and controlling demand at the source. Keep this practical. A smaller relief setting may help, but only after confirming force requirements and transient pressure spikes.
Pipe sizing deserves careful attention. High velocity increases friction, noise, and contamination sensitivity. Use larger suction lines, short return paths, and smooth bends where space permits. Hydraulic Institute guidance links friction loss to flow velocity and internal surface conditions. Clean oil helps, too. ISO 4413 stresses correct component selection, cleanliness, and safe pressure control. In practice, achieving less than 10% loss is not always possible. I have seen acceptable calculations fail after hose aging, sharp fittings, or clogged filters. Recheck the circuit after installation, then compare readings against the design target.
Representative hydraulic circuit comparisons showing how operating pressure, flow rate, pipe diameter, line length, and fitting resistance influence total pressure loss.
| System Case | Operating Pressure | Flow Rate | Internal Pipe Diameter | Line Length | Estimated Velocity | Estimated Total Pressure Loss | Pressure Loss Ratio | Recommended Action | Performance Status |
|---|---|---|---|---|---|---|---|---|---|
| Optimized actuator supply line | 80 bar | 20 L/min | 15 mm | 10 m | 1.89 m/s | 3.8 bar | 4.8% | Maintain the current pipe size and use smooth-radius bends. | Within target |
| High-flow pressure line | 100 bar | 40 L/min | 20 mm | 12 m | 2.12 m/s | 2.7 bar | 2.7% | Keep the line diameter; verify valve and connector pressure ratings. | Within target |
| High-flow compact machine circuit | 140 bar | 60 L/min | 20 mm | 15 m | 3.18 m/s | 6.7 bar | 4.8% | Use a high-quality filter and minimize unnecessary elbows and adapters. | Within target |
| Undersized actuator supply line | 100 bar | 25 L/min | 10 mm | 8 m | 5.31 m/s | 30.0 bar | 30.0% | Increase the internal diameter to approximately 15 mm and reduce restrictive fittings. | Exceeds target |
| Long high-flow pressure line | 120 bar | 100 L/min | 25 mm | 18 m | 3.40 m/s | 5.7 bar | 4.8% | Retain the pipe size and confirm that the return line is not undersized. | Within target |
| Return line with moderate flow | 70 bar | 30 L/min | 18 mm | 10 m | 1.96 m/s | 2.7 bar | 3.9% | Maintain the return-line diameter and keep the reservoir connection unrestricted. | Within target |
| Marginally sized pressure line | 90 bar | 50 L/min | 15 mm | 10 m | 4.72 m/s | 12.8 bar | 14.2% | Increase the internal diameter to approximately 20 mm to reduce velocity and heat generation. | Needs improvement |
| Efficient low-flow control circuit | 160 bar | 12 L/min | 12 mm | 6 m | 1.77 m/s | 1.9 bar | 1.2% | Maintain the configuration and monitor filter contamination during operation. | Within target |
Hydraulic fluid viscosity strongly affects pump efficiency, valve response, and component protection. Keep it within the manufacturer’s recommended 15–40 cSt range during normal operation. Fluid that is too thin may increase internal leakage and accelerate wear. Fluid that is too thick can cause slow movement, higher energy use, and difficult cold starts. Temperature changes matter. A fluid measuring 35 cSt at room temperature may become much thinner after several hours of operation.
In field inspections, I check viscosity alongside operating temperature, fluid level, and filter condition. A small fluid sample can reveal oxidation, contamination, or incorrect fluid selection. Use a calibrated viscometer when possible, and record the temperature with each reading. Do not judge viscosity by appearance alone. It can look clean and still perform poorly. I have also seen technicians replace fluid without checking the cause of viscosity change. That fixes symptoms, not the system.
Tips: Sample fluid from a warm, circulating system, but follow safe procedures. Compare results with the equipment manual. Inspect filters for unusual particles. Check for water contamination. If readings approach 15 or 40 cSt, investigate before performance declines. Recheck after maintenance. One missed temperature reading can distort the entire assessment. Calibration is easy to overlook.
Hydraulic efficiency often falls before a machine stops. Heat is an early warning. Keep reservoir oil below 60°C during normal operation. At this level, seals, hoses, and fluid usually face less thermal stress. A 10°C rise can roughly double oxidation speed, a widely used maintenance rule. It is not a universal law. Fluid formulation, pressure, contamination, and aeration can change the result. Treat 60°C as a control limit, not a guarantee.
Install a calibrated sensor near the return line. Record temperature during start-up, peak load, and cool-down. A rise from 52°C to 59°C deserves investigation, even when production continues.
Preventive maintenance makes this response practical. Check cooler fins, oil level, suction strainers, relief settings, and unusual noise each shift. Sample fluid periodically and compare viscosity, water content, particle counts, and ISO 4406:2017 cleanliness codes.
The U.S. Department of Energy’s Operations & Maintenance Best Practices Guide reports 12–18% cost savings for preventive maintenance versus reactive maintenance. It also reports possible savings of 25–30% with predictive maintenance. These figures are benchmarks, not promises. A blocked cooler can erase them quickly.
Replace filters by condition when monitoring supports it, rather than relying only on calendar dates. Still, calendar inspections matter. A clean-looking reservoir can hide varnish inside a valve body. That mistake is expensive. Define an alarm, an inspection owner, and a documented corrective action before temperature crosses 60°C.
Many systems can reasonably target 80–90% overall efficiency. This includes the motor, pump, valves, actuators, and transmission lines. The target is practical, not sacred. Short-duty equipment may justify lower efficiency. A good percentage can still hide unstable pressure or overheated oil.
Record electrical input power, hydraulic pressure, flow rate, oil temperature, and actuator output. Take readings during normal production. Repeat them across several operating shifts. One convenient test can mislead you. A simple power balance may reveal leakage, throttling, or mechanical friction.
Compare system pressure with the actuator’s actual requirement. For example, a gauge may show 210 bar while the actuator needs 160 bar. The difference often becomes unwanted heat. Check relief-valve activity and standby pressure. A smaller pump may help, but confirm flow needs before changing it.
Keep fluid viscosity within the recommended 15–40 cSt range during normal operation. Fluid below 15 cSt may increase internal leakage and wear. Fluid above 40 cSt can slow movement and raise energy use. Cold starts may become difficult. Temperature changes matter greatly.
Sample fluid from a warm, circulating system using safe procedures. Measure viscosity with a calibrated viscometer when possible. Record the fluid temperature beside every reading. Do not judge viscosity by appearance alone. Clean-looking fluid can still perform poorly.
Keep reservoir oil below 60°C during normal operation. Install a calibrated sensor near the return line. Record temperature during startup, peak load, and cooldown. A rise from 52°C to 59°C deserves attention. Heat is an early warning.
Inspect cooler fins, oil level, suction strainers, relief settings, filters, and unusual noise. Check these items during each shift. Sample fluid periodically for viscosity, water, particles, and cleanliness. Replace filters according to condition when reliable monitoring supports it. Calendar inspections still matter.
No. An efficiency result cannot show everything. A calculated 87% may still hide unstable pressure, contamination, or seal wear. Review several shifts and operating conditions. Recheck performance after repairs. I might trust one impressive number too quickly. That is a mistake worth correcting.
Improving hydraulic system performance begins with understanding what affects the performance of hydraulic systems, including efficiency, contamination, pressure, flow, viscosity, temperature, and maintenance practices. Aim for an overall system performance of 80–90% by reducing energy losses and ensuring that components work together effectively. Keep hydraulic fluid clean, preferably meeting ISO 4406 cleanliness code 17/15/12 or better, to minimize wear, valve sticking, and unexpected failures.
Correctly balance pressure and flow, and select suitable pipe sizes to keep pressure loss below 10%. Maintain fluid viscosity within the manufacturer’s recommended range of 15–40 cSt, since fluid that is too thick or too thin can reduce efficiency and damage components. Operating temperature should remain below 60°C through proper cooling and heat management. Finally, use regular inspections, filtration, fluid checks, and preventive maintenance to identify problems early, reduce downtime, extend equipment life, and maintain reliable hydraulic performance.

Aksurion Hydraulic